

Japanese Candlesticks Analysis 16.03.2015 (EUR/USD)
FXTM Online Analysis Department.
EUR USD, “Euro vs. US Dollar”
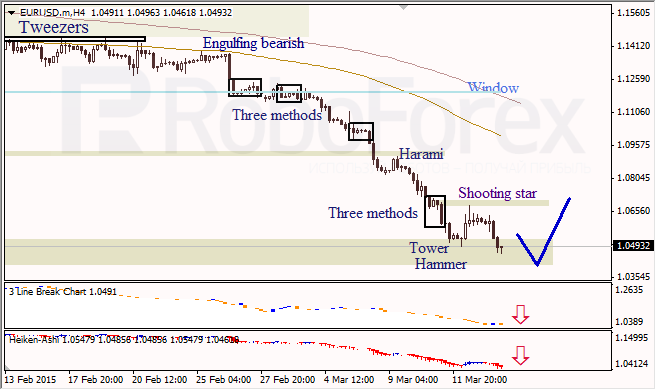
As we can see at the H4 chart of EUR USD, the downtrend continues. The price has reached more than 10 lows at the daily chart, which means that the market may start a correction soon. Three Line Break chart and Heiken Ashi candlesticks indicate a bearish movement.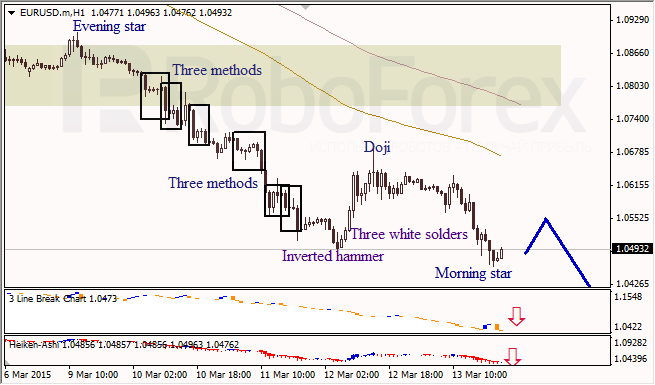
The H1 chart of EUR USD also shows the downtrend. Morning Star pattern indicates a possible correction. Three Line Break chart and Heiken Ashi candlesticks indicate a descending movement.


0 comments:
Post a Comment